Iteration 3: Greens for Everyone and More
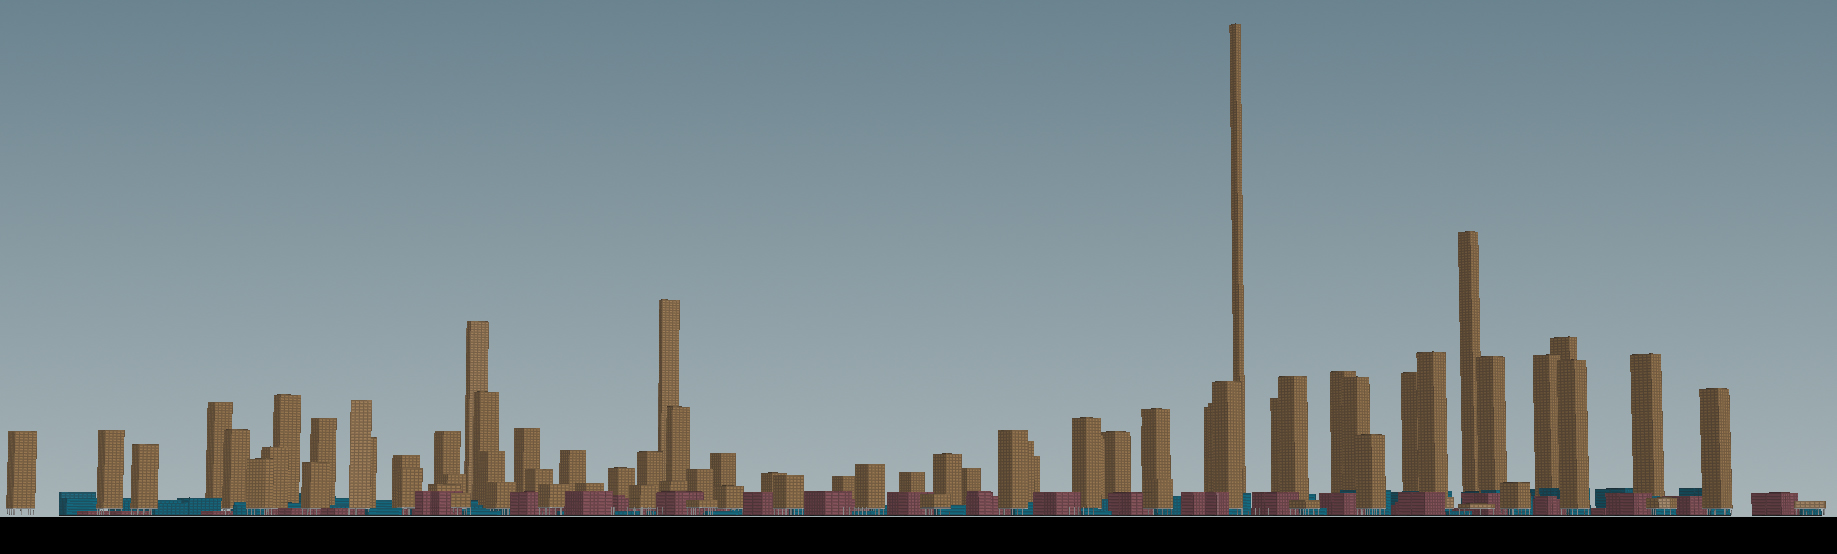
1 elevation
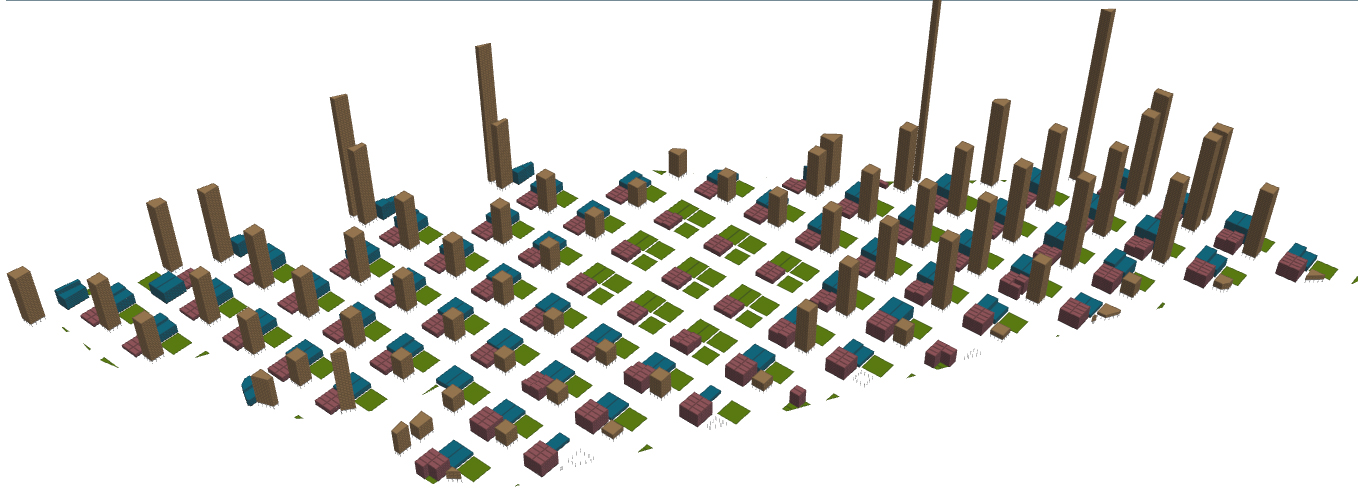
The typology of the third iteration is in lieu with iteration 1 and 2, emulating one of a highly dense built-up environment. The height of the residential blocks are affected by the proximity to the MRT nodes, although certain anomalies have started to appear. This is probably due to the stress placed on the fulfilment of the allocated 75m^2 per person on the site while still having to satisfy the notion of preplanned greens and designation of central park in this iteration. The elevation shows the skyline of the urban planning. The distribution is becoming one of large discrepancy between the residency and others programmes like commerical and offices. There was a sudden increase in building height, where 1 building is an anomaly in its extreme height, as well as a number of pretty tall skyscrapers.
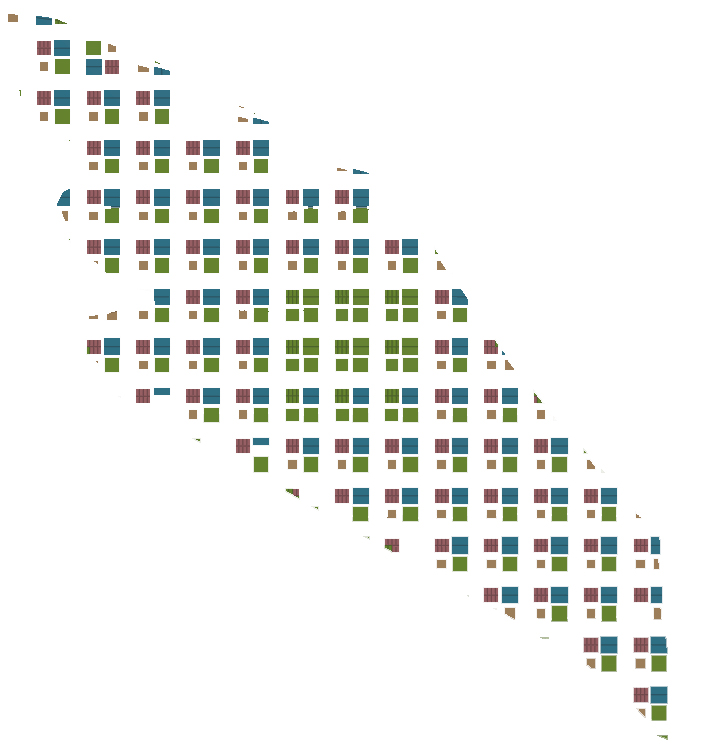
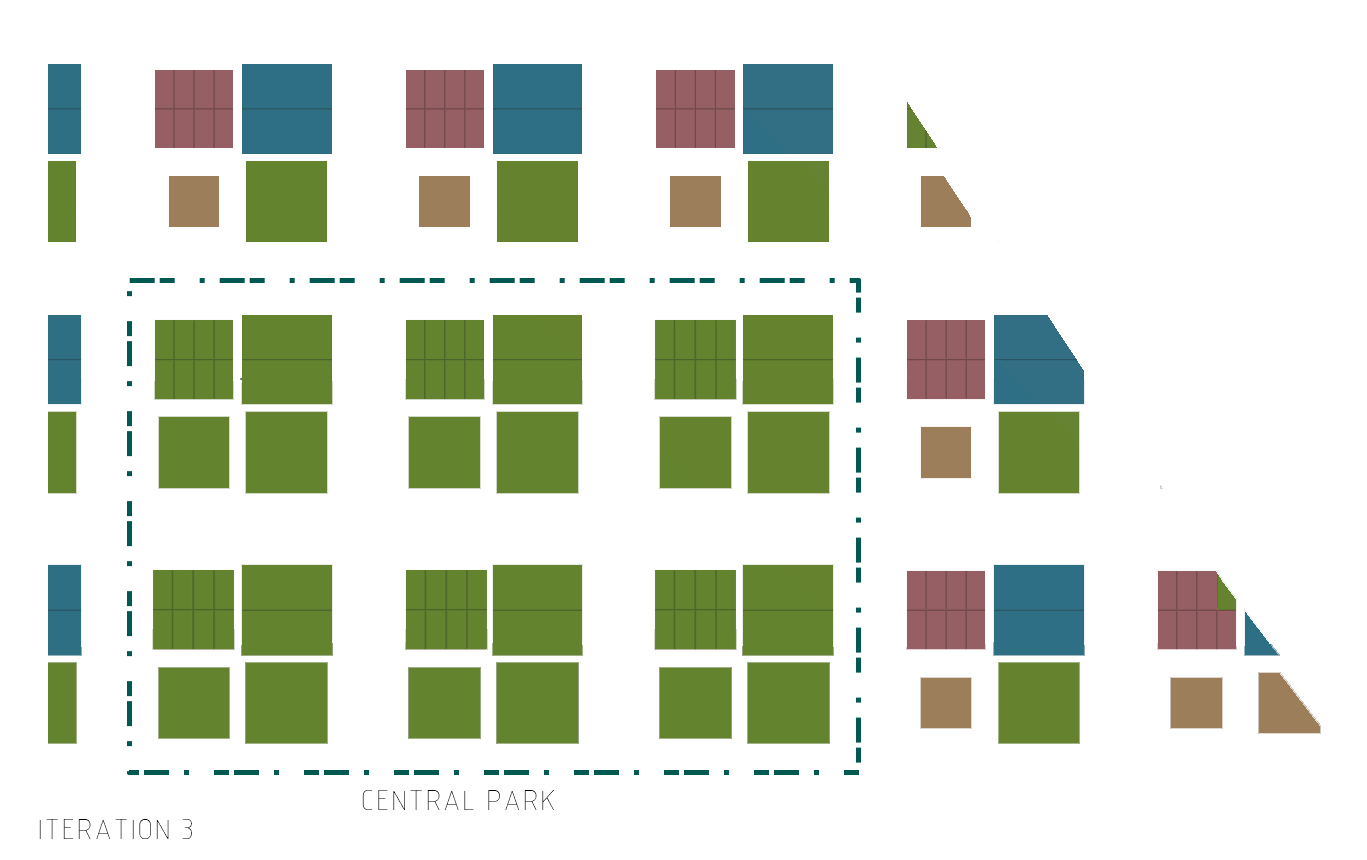
2 urban plan
The greens are allocated in 2 ways: one of the subplot in the urban plot that manifest itself as a 1000m^2 localized green space to be shared by each plot's users and the other in the form of a central park.
Road Width: 20m
Total No. of Buildings: 774
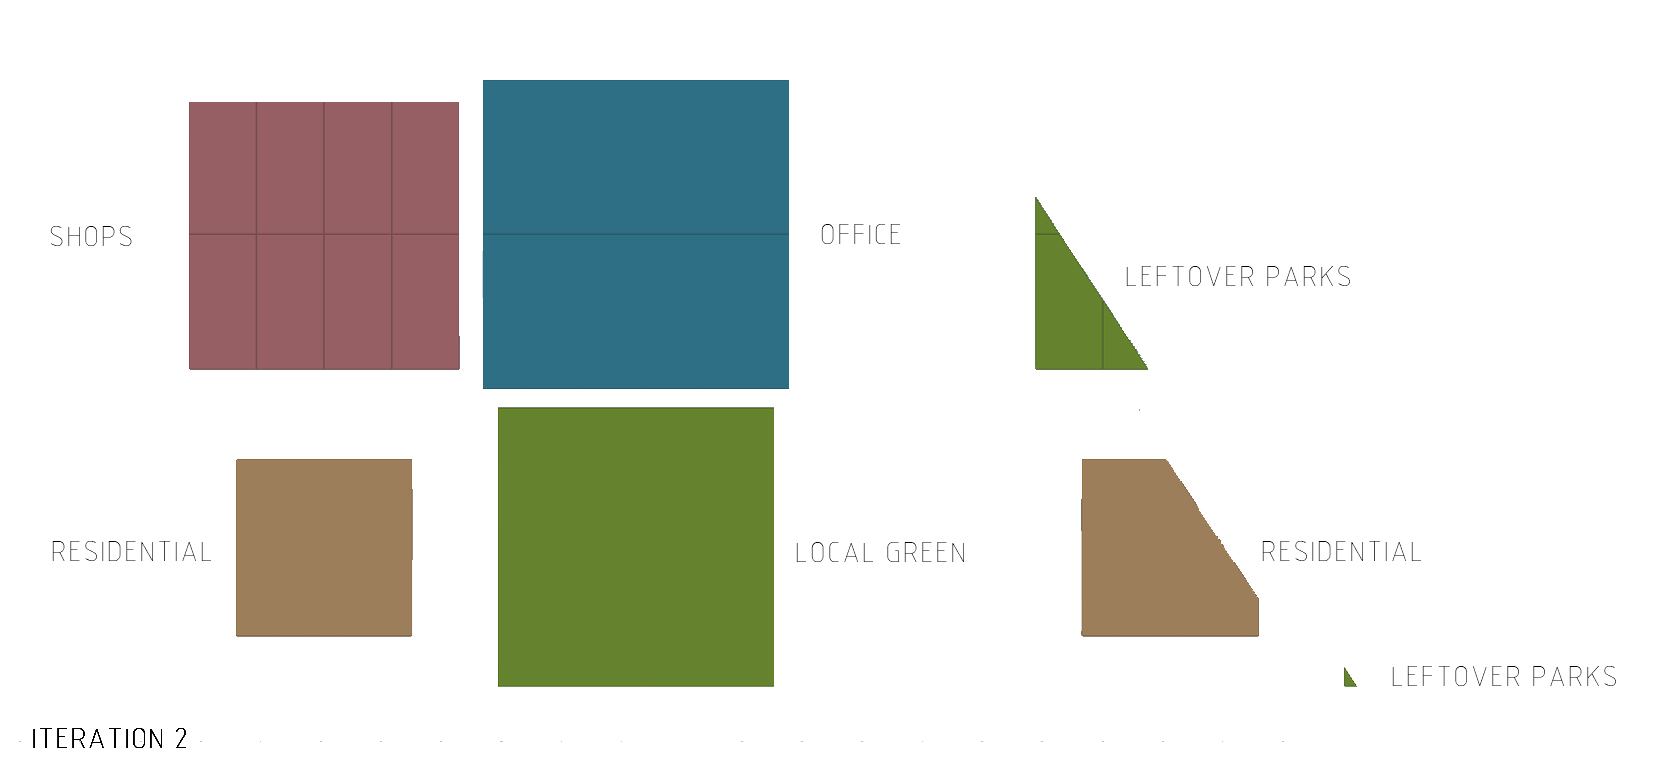
3 plot allocation
A total of 75m^2 is allocated to each person on site. The following is the breakdown of the allocation of plot percentage. Residential was allocated the highest percentage for improved standard of living.
Commercial: 10m^2
Office: 15m^2
Residential: 50m^2
`
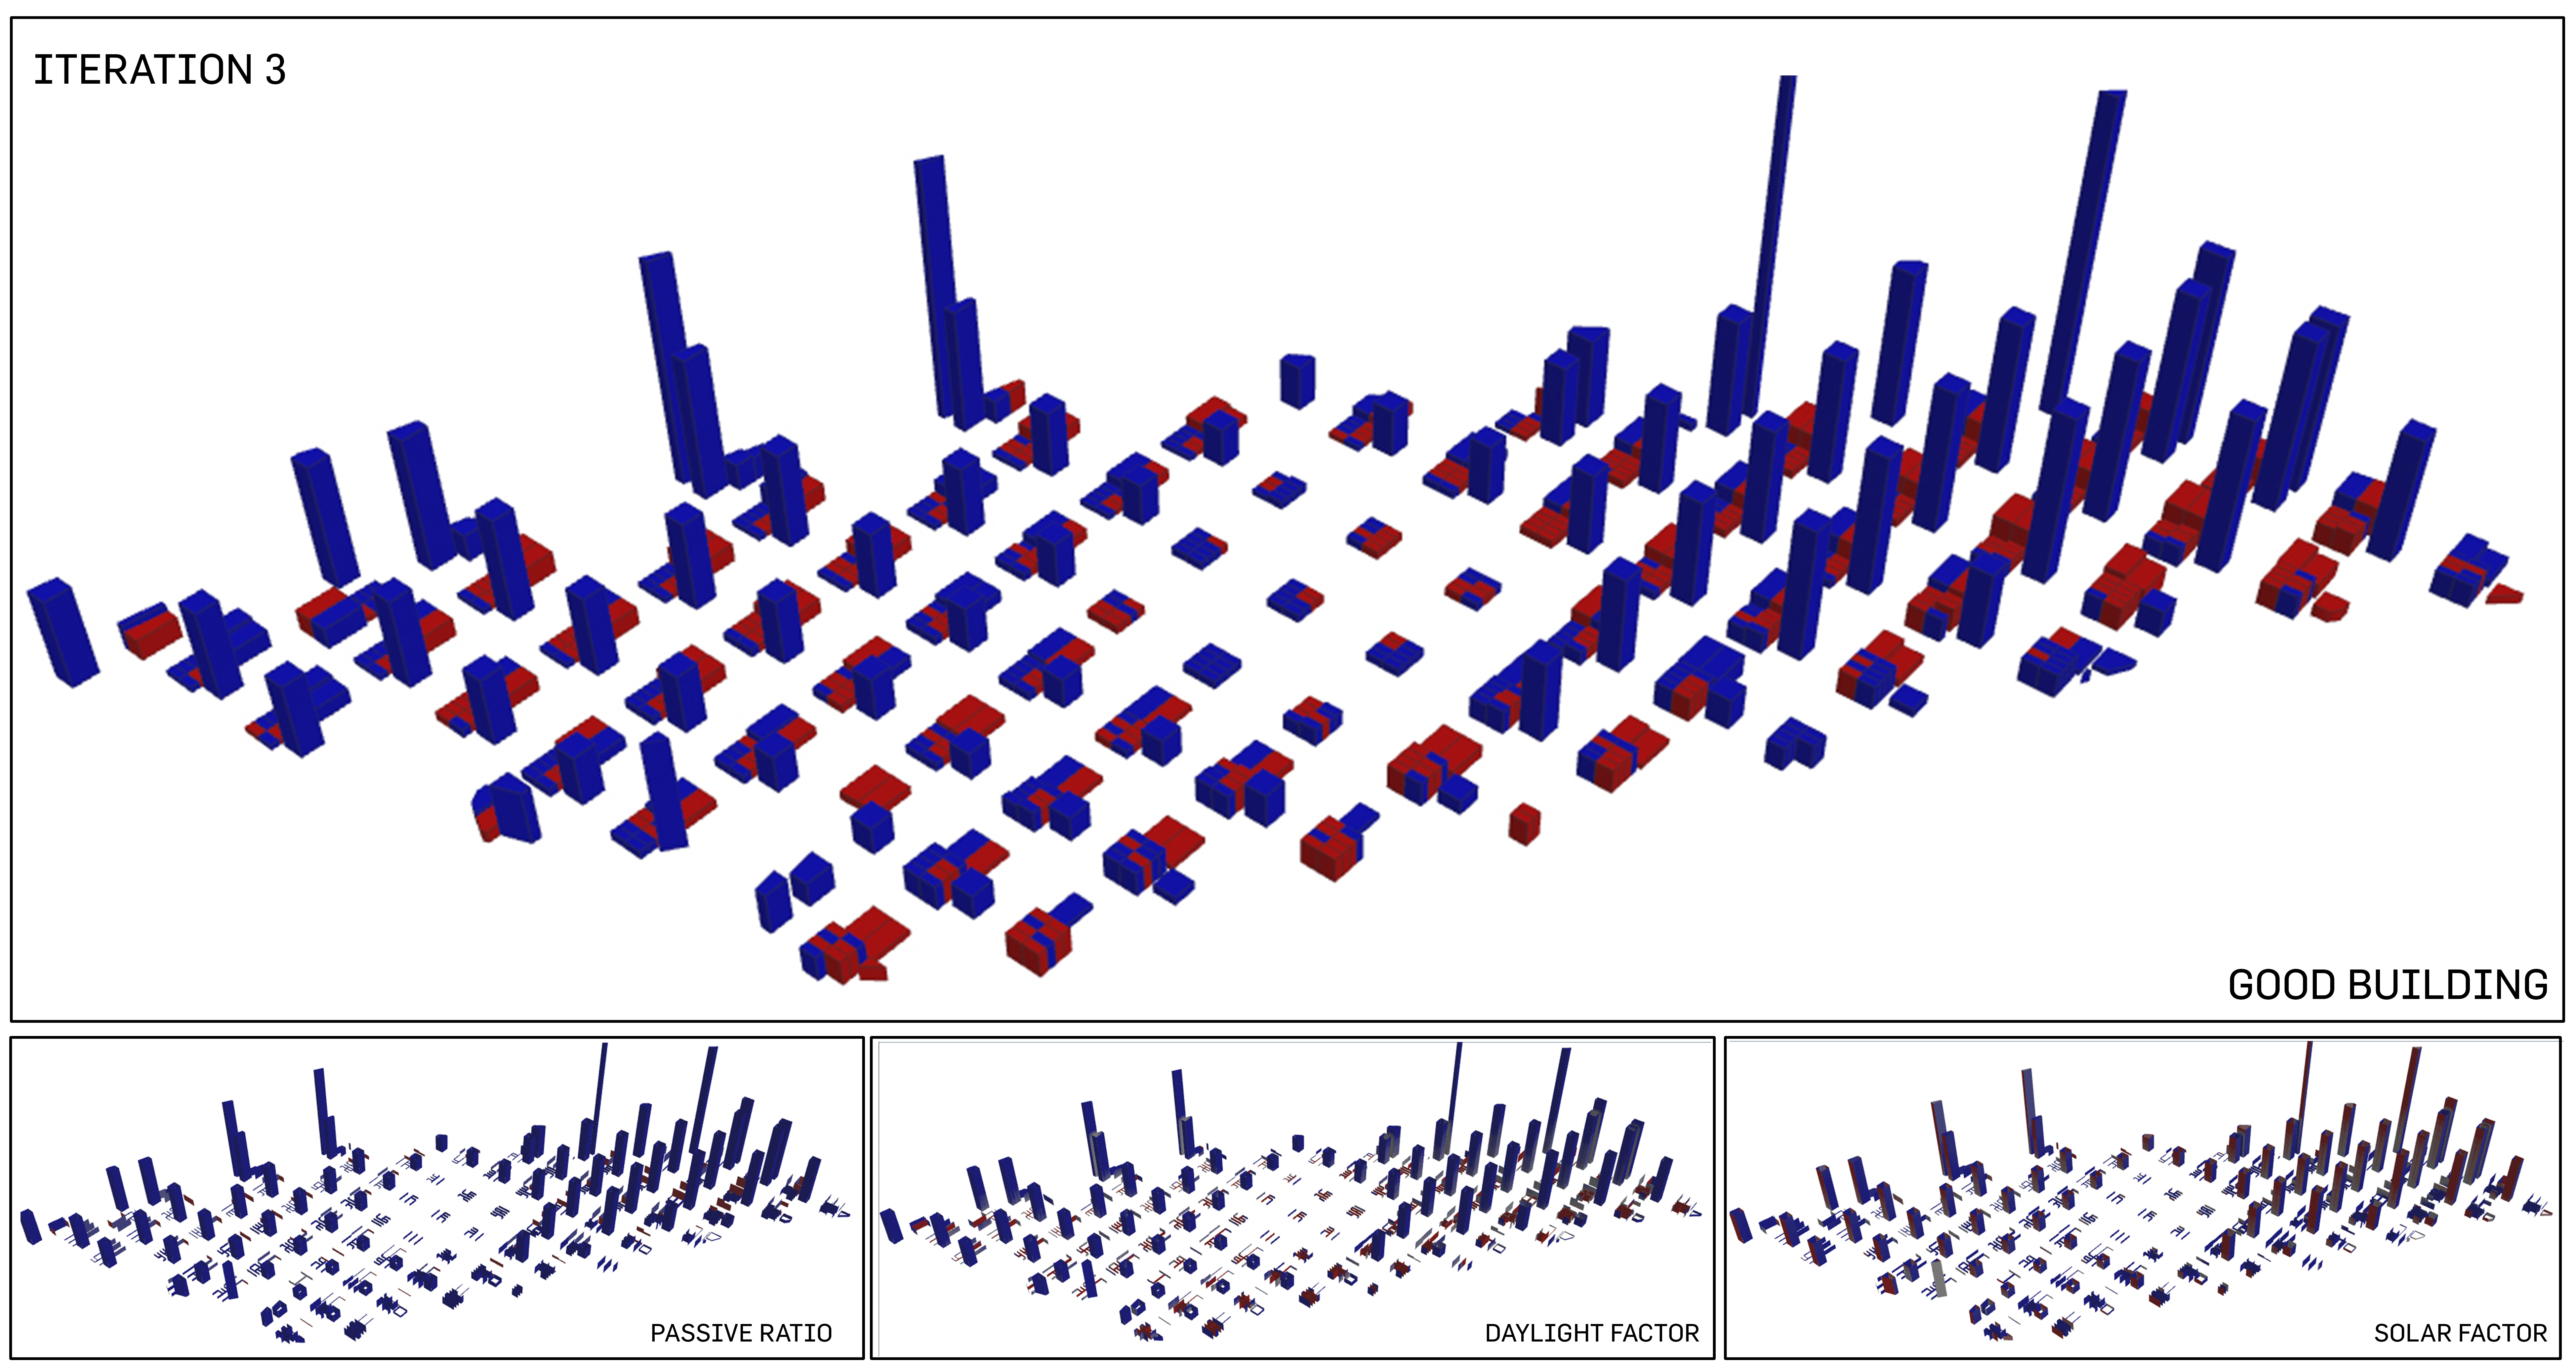
4 analysis of good buildings
One thing noticeable is the constant reading of "good" building for the residential blocks, even as they start to go oddly disproportionate in terms of scale. Commerical facing the central park has changed its reading to "good" as well; this may raise further hypothesis of the benefits of multiple satellite greens on one urban (instead of iteration 3 where there is only 1 central park) that may benefit the buildings. The passive ratio has been increasing while solar factor, as always, suffers as the daylight factor and passive ratio increases.
Percentage of Good Buildings: 52.2%
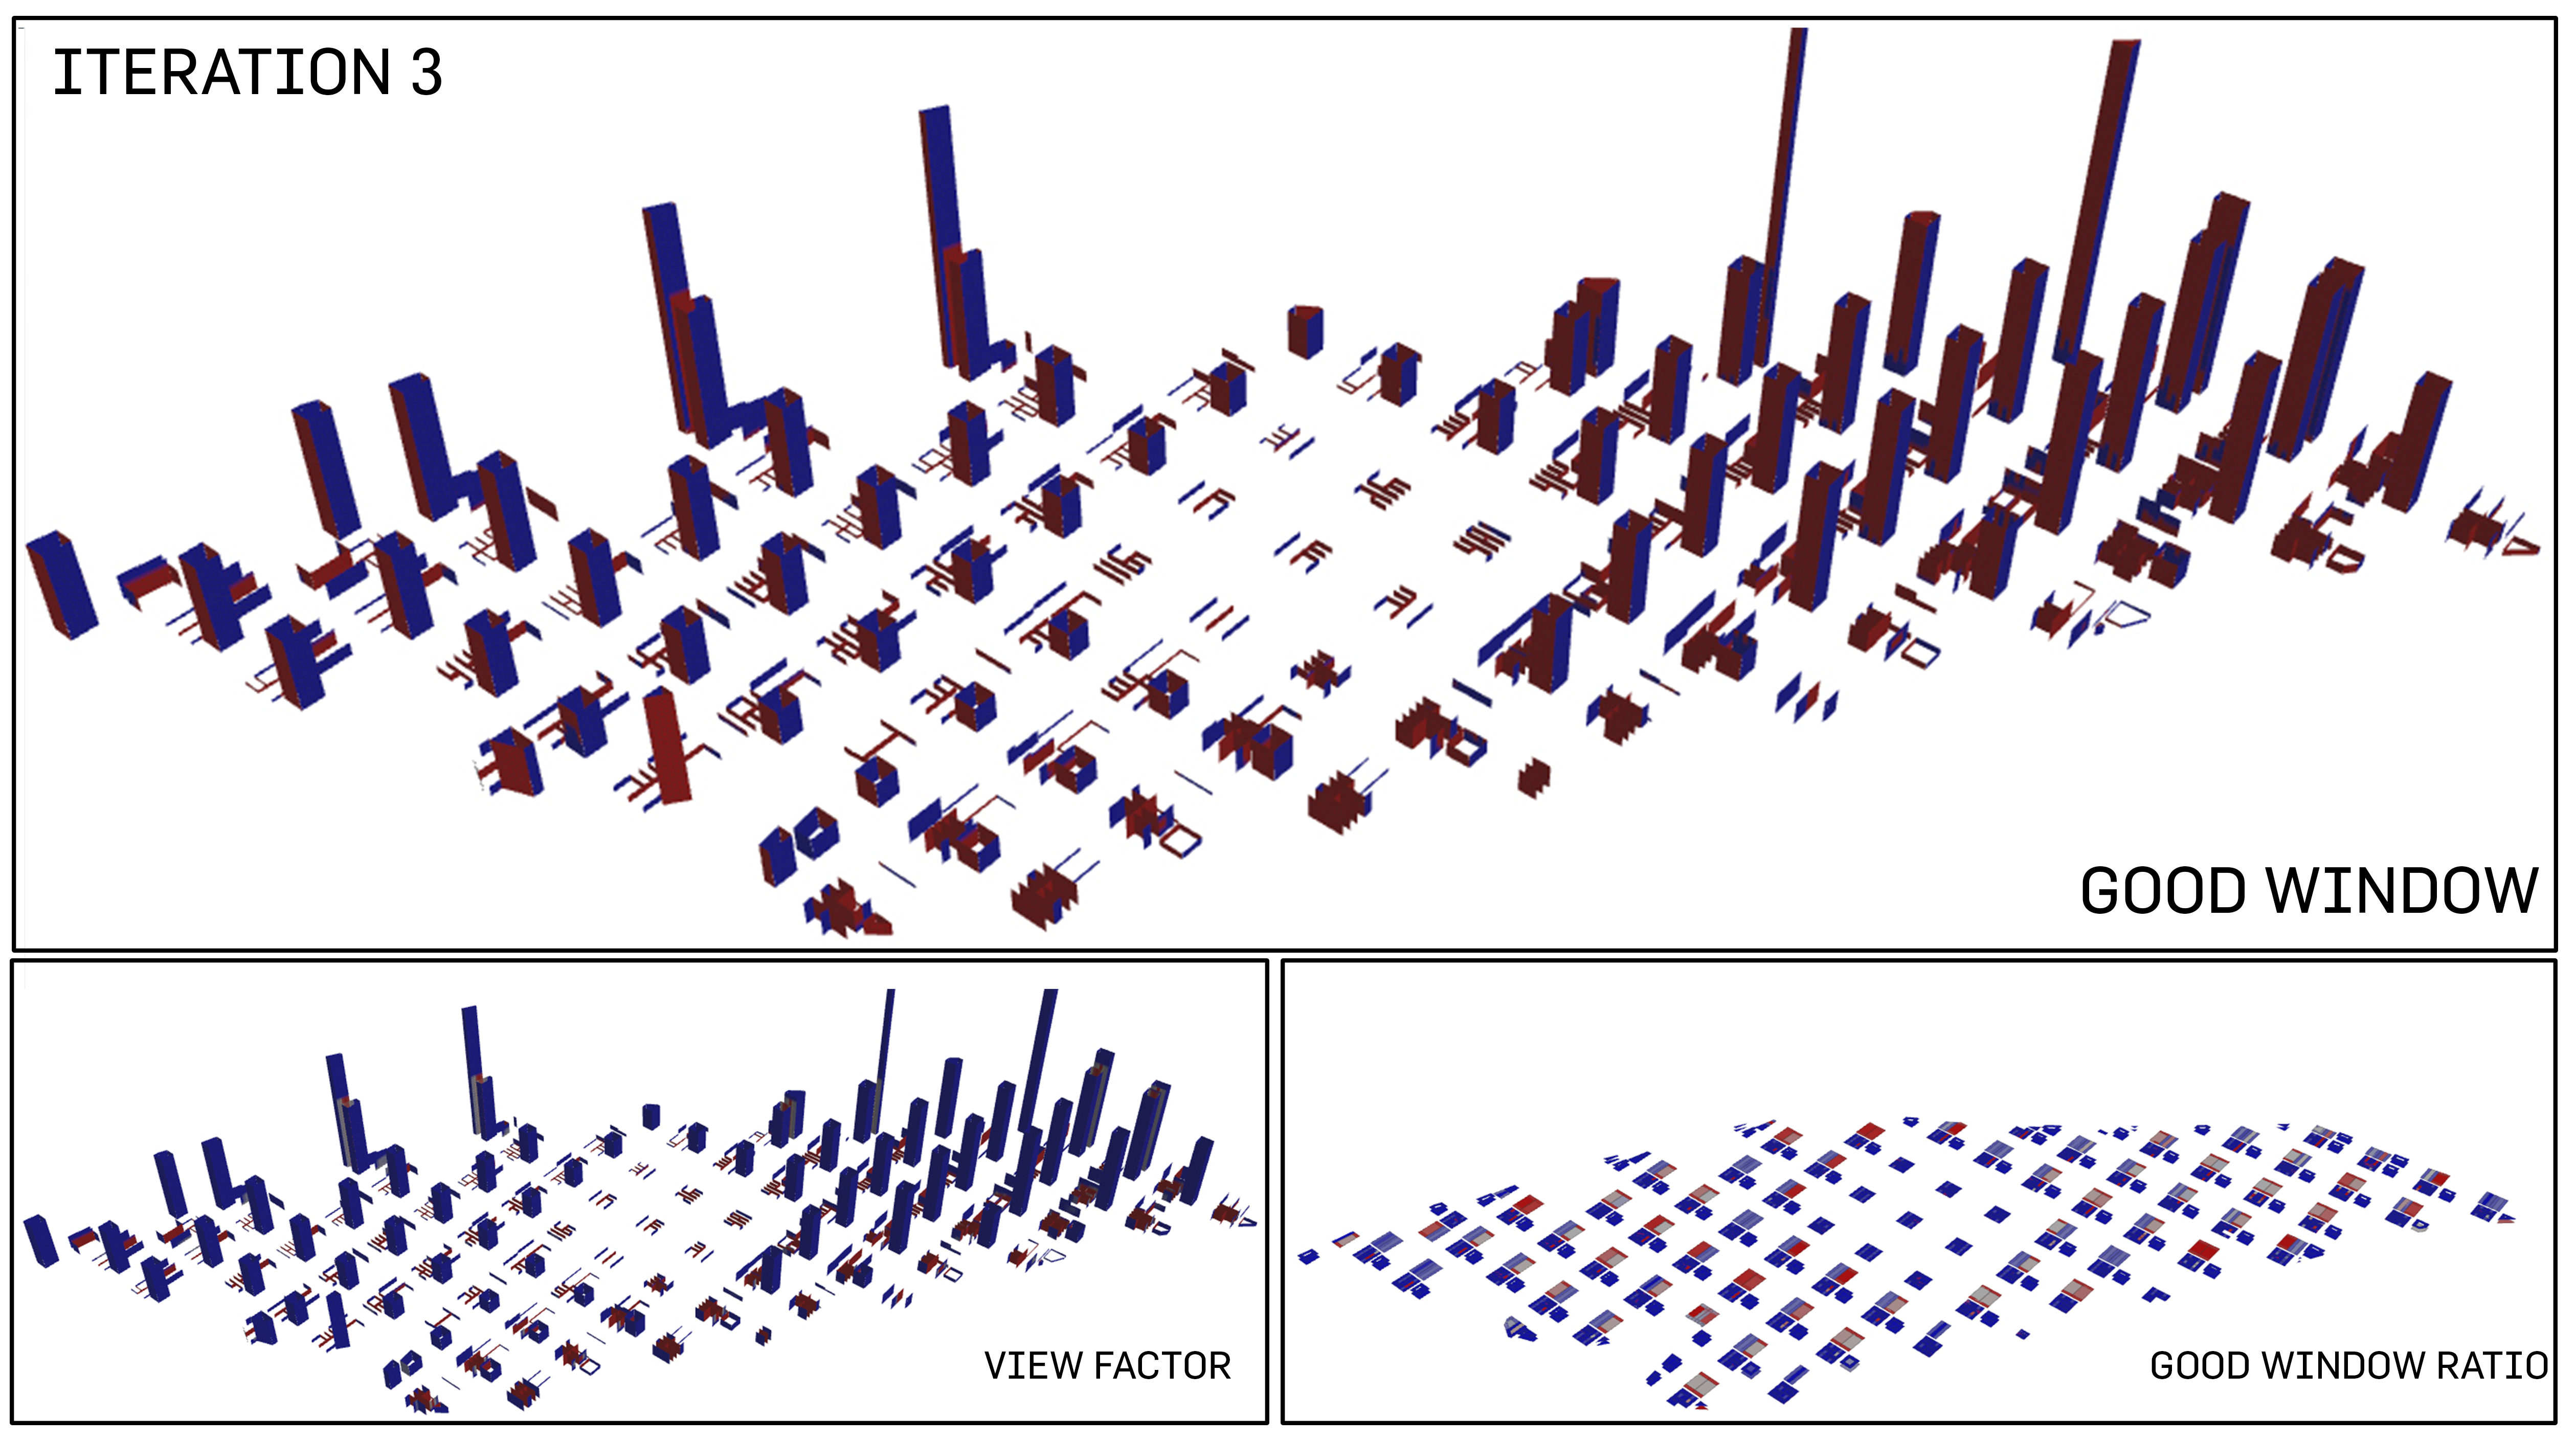
4 analysis of good windows
The readings for good windows has been contradicatory. The percentage showcases a high of 83.2% when the simulation has described multiples of "bad" windows. In stark contrast, the view factor and good window ratio has visibly improved.
Percentage of Good Windows: 83.2%
Evaluation
This iteration further demonstrated the connection between green spaces and the certain increases in certain factors such as daylight factor, view factor and passive ratio. However, the connection that drives the disappointing results of the good window, solar factor and good building is also one to note specifically.