Iteration 1: Leftover Greens
1 elevation
This first iteration is an example of a highly dense built-up environment. The height of the residential blocks are affected by the proximity to the MRT nodes. The elevation shows the skyline of the urban planning. The distribution is fairly well gradient. There were no sudden increase in building height.
2 urban plan
The greens are allocated in the periphery of the urban plot that manifest itself as leftover spaces of areas less than 150m^2. This is an enactment of when the naturalscape is not accounted for, or purposefully designed for.
Road Width: 16m
Total No. of Buildings: 855
3 plot allocation
A total of 75m^2 is allocated to each person on site. The following is the breakdown of the allocation of plot percentage. Residential was allocated the highest percentage for improved standard of living.
Commercial: 10m^2
Office: 15m^2
Residential: 50m^2
`
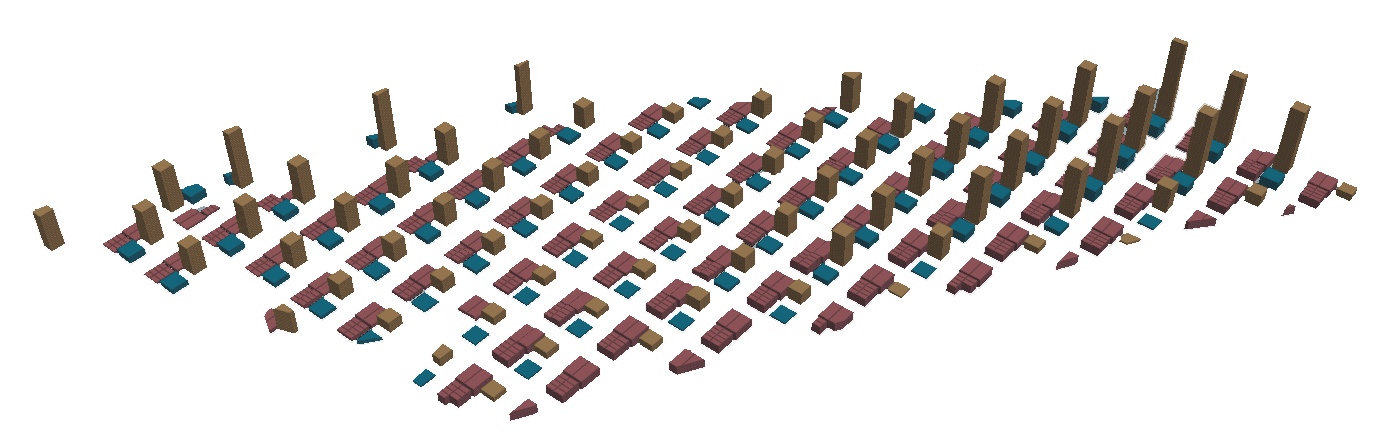
4 analysis of good buildings
It is visible from the analysis that the majority of the good buildings are the residential blocks. This is in line with the good results from the passive ratio and daylight factor. However, in terms of the solar factor, it is exposed to high amount of solar radiation from the east-west facing windows, resulting in some "bad" readings of the buildings.
Percentage of Good Buildings: 38.6%
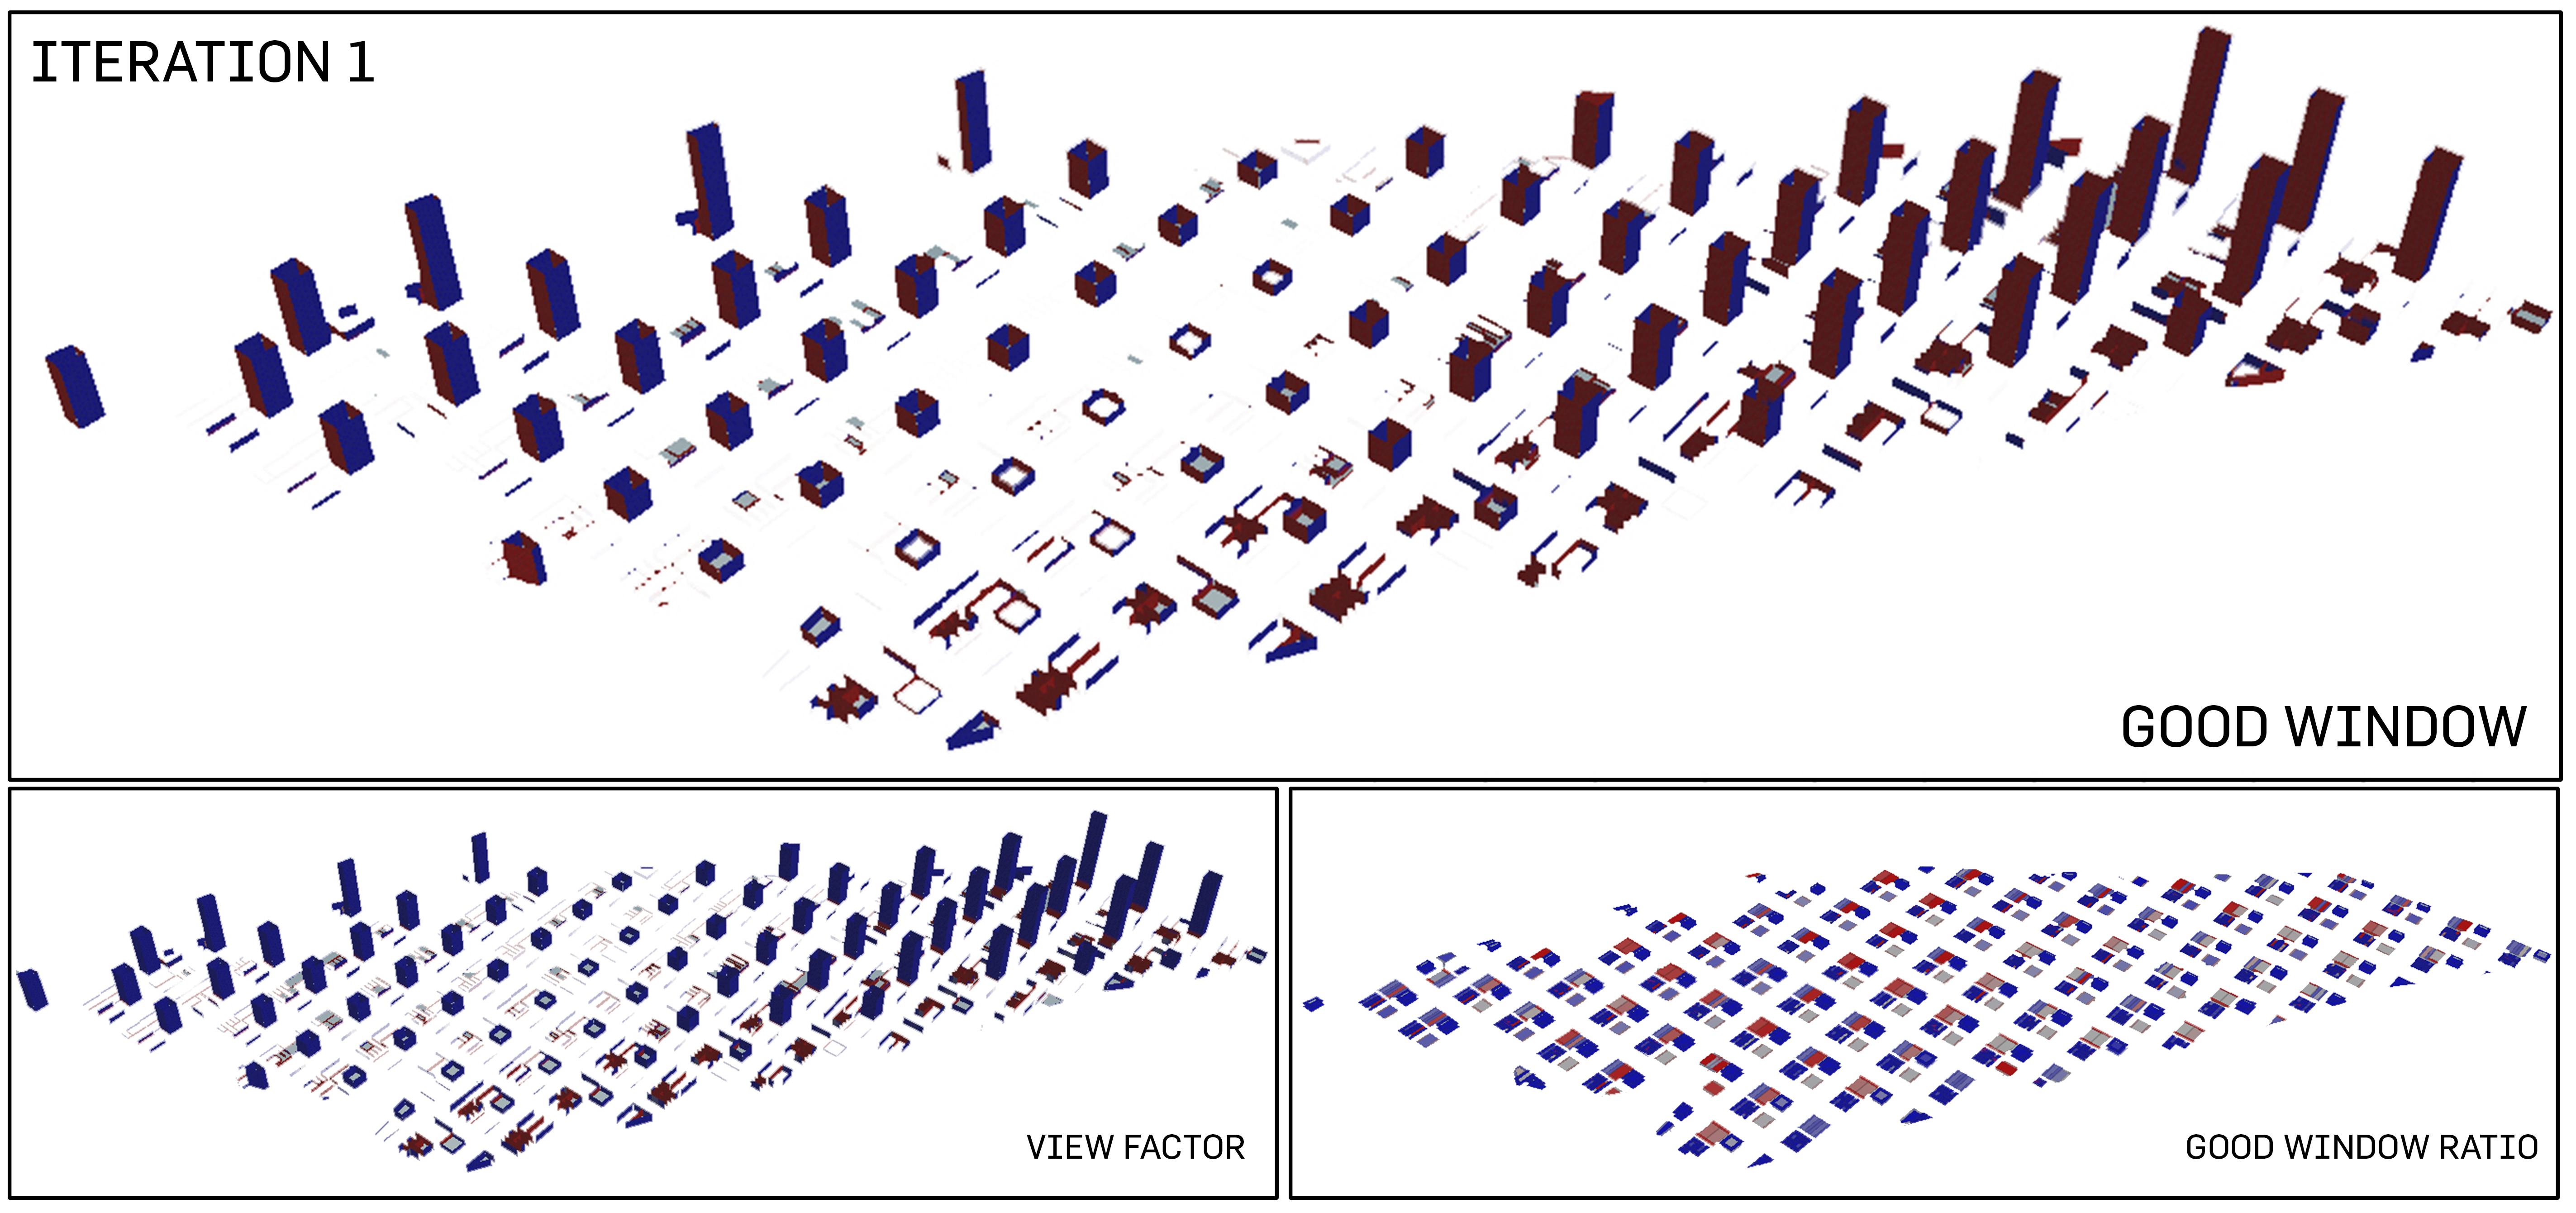
4 analysis of good windows
The high percentage of good windows came as a surprise due to the high amount of solar radiation that high-rised buildings would be exposed to. Overall, the view factor was positive, as well as the good window ratio.
Percentage of Good Windows: 83.9%
Evaluation
Although this was an iteration that did not take into account of the greens, the percentage of good windows was unexpectedly good. However, whether or not this would lead to a better urban environment would require more simulations.