Iteration 2: “Organic” City – Mixed Urban Grain; Plot function determined by Area
In this iteration, Plots were divided into four or more until each plot reaches a certain size. Irregular and small plots were merged. Larger Parks, Industrial, and Mixed Residential-Commercial Plots were identified first, followed by other more fine-grained commercial, residential, and Industrial plots. Civic buildings were introduced into this iteration for the left-over small plots scattered around the site. They will subsequently serve as a density attractor for residential plots.
Set-up
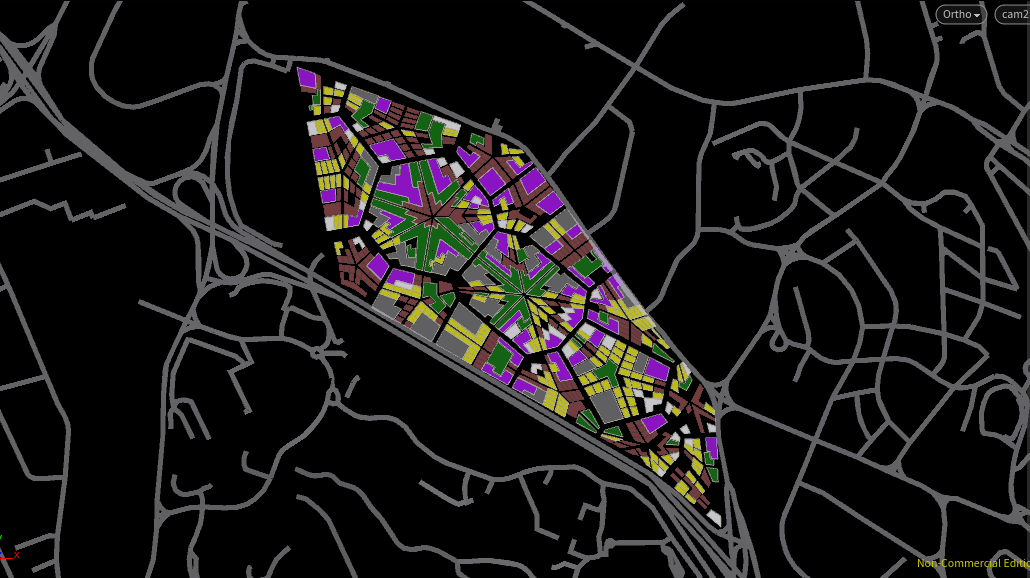 Interestingly, the resulting program distribution created radial parks, commercial, and residential plots around the site – each with a mixed scatter of other programs.
Weighting Relative Density Calculations
To control the favourable conditions for each program, parameters are established as weights for the calculation of the relative densities
- Industrial
- Proximity to AYE (reversed): 0.015
- Proximity to MRT: 0.893
- Proximity to Central Points: 0.247
- Proximity to Arterial Roads (reversed): 0.013
- Proximity to Parks: 0.206
- Proximity to Civic Buildings: 0.015
- Commercial
- Proximity to AYE (reversed): 0.015
- Proximity to MRT: 0.514
- Proximity to Central Points: 1
- Proximity to Arterial Roads (reversed):0.013
- Proximity to Parks: 0.765
- Proximity to Civic Buildings: 0.021
- Residential
- Proximity to AYE (reversed): 1
- Proximity to MRT: 1
- Proximity to Central Points: 0.232
- Proximity to Arterial Roads (reversed): 0.869
- Proximity to Parks: 1
- Proximity to Civic Buildings: 0.807
Relative Density Calculations were weighted as above to achieve
- Denser Industrial and Commercial Buildings near AYE and Arterial Roads – Inverse for Residential due to noise
- Industrial and Residential with higher proximity to the MRT to cater to the working class
- Commercial with high proximity to the city centres
- Commercial and Residential with high proximity to the Parks
- Denser Residential where it is near a civic building
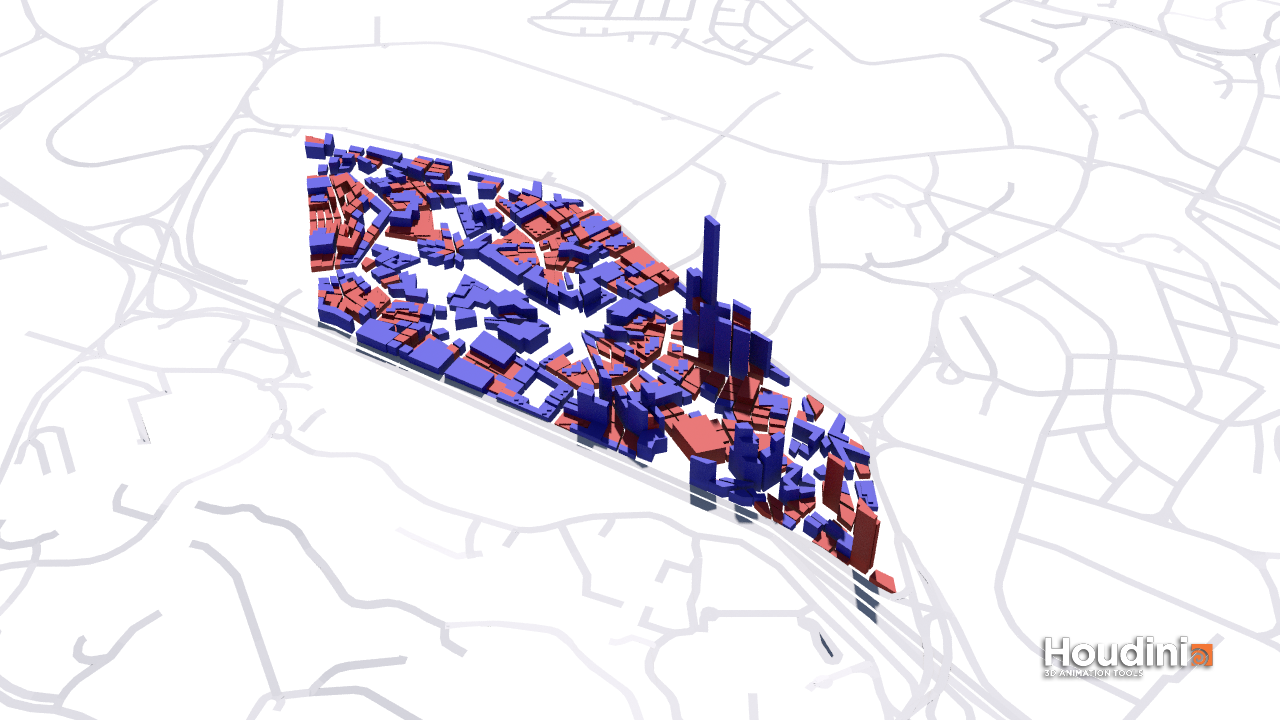
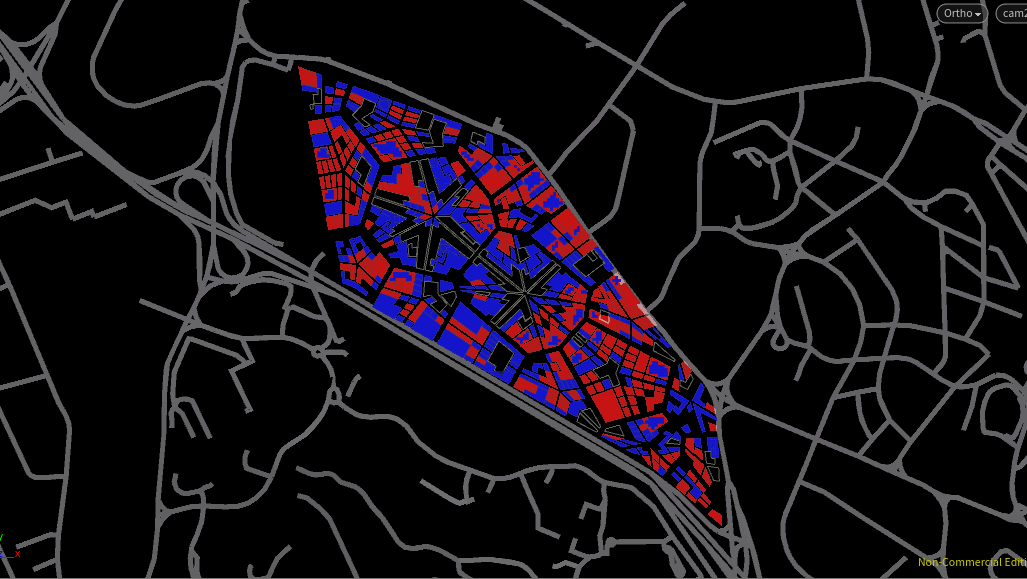
Resulting Relative Densities
The more favourable a plot is for the program, the denser the plot is – highlighted in blue in the following images.
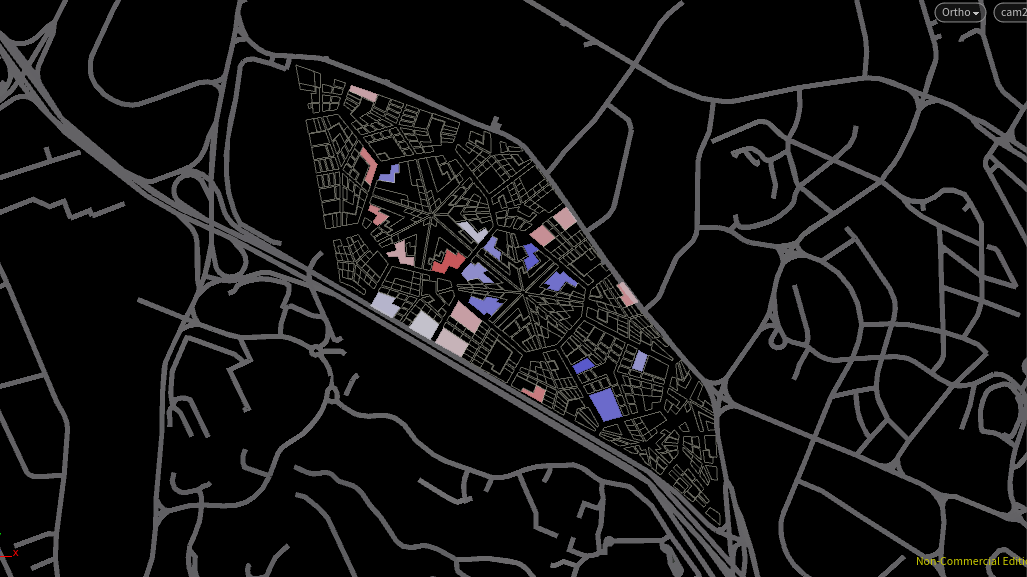 Relative Density for Industrial
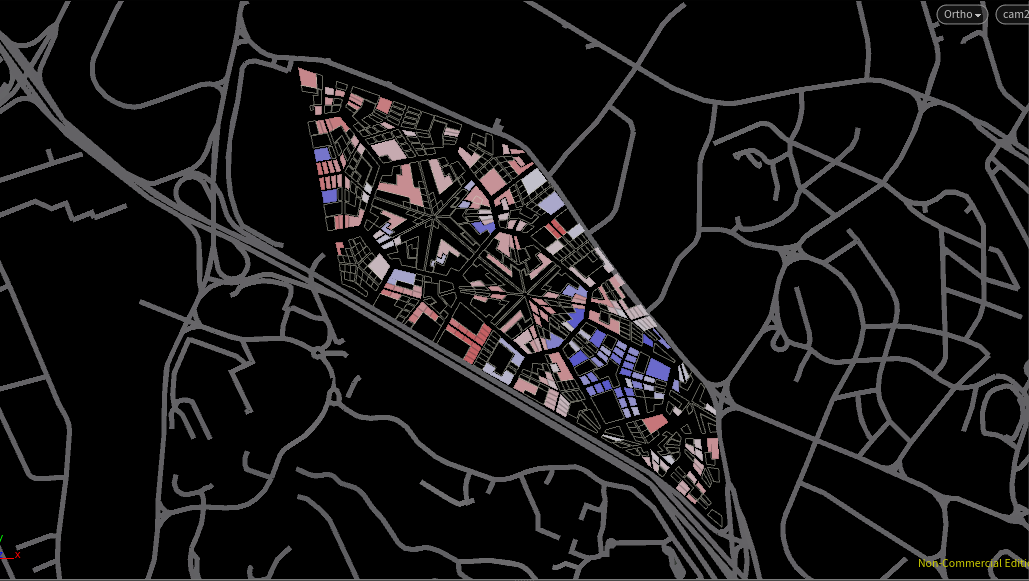 Relative Density for Commercial
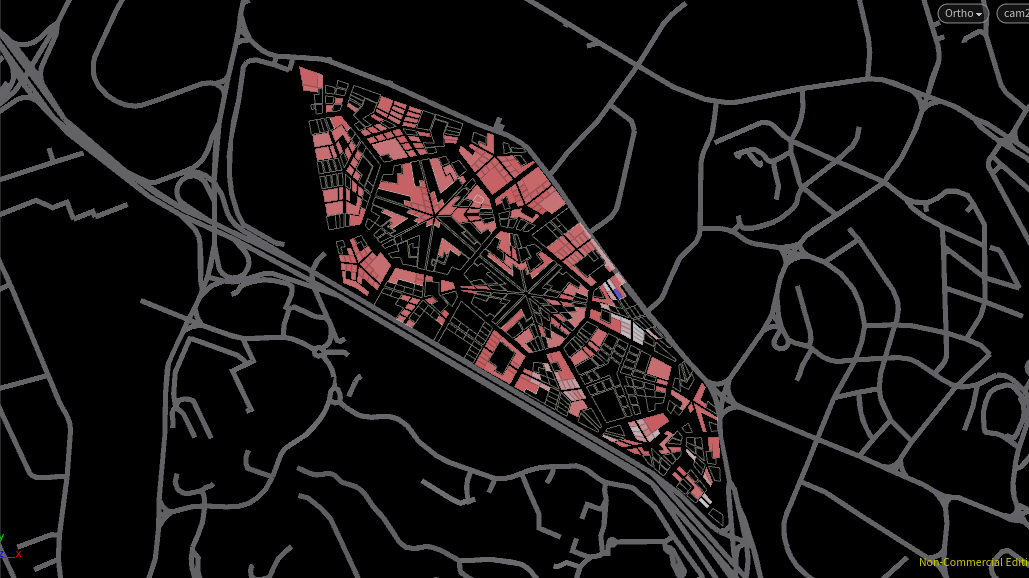 Relative Density for Residential
Floor Area/Head
The following floor area/head was used to generate the city massing. To accommodate the new civic program, floor area/head for residential was reduced.
- Industrial: 5sqm
- Commercial: 8sqm
- Residential: 20sqm
- Civic: 2sqm
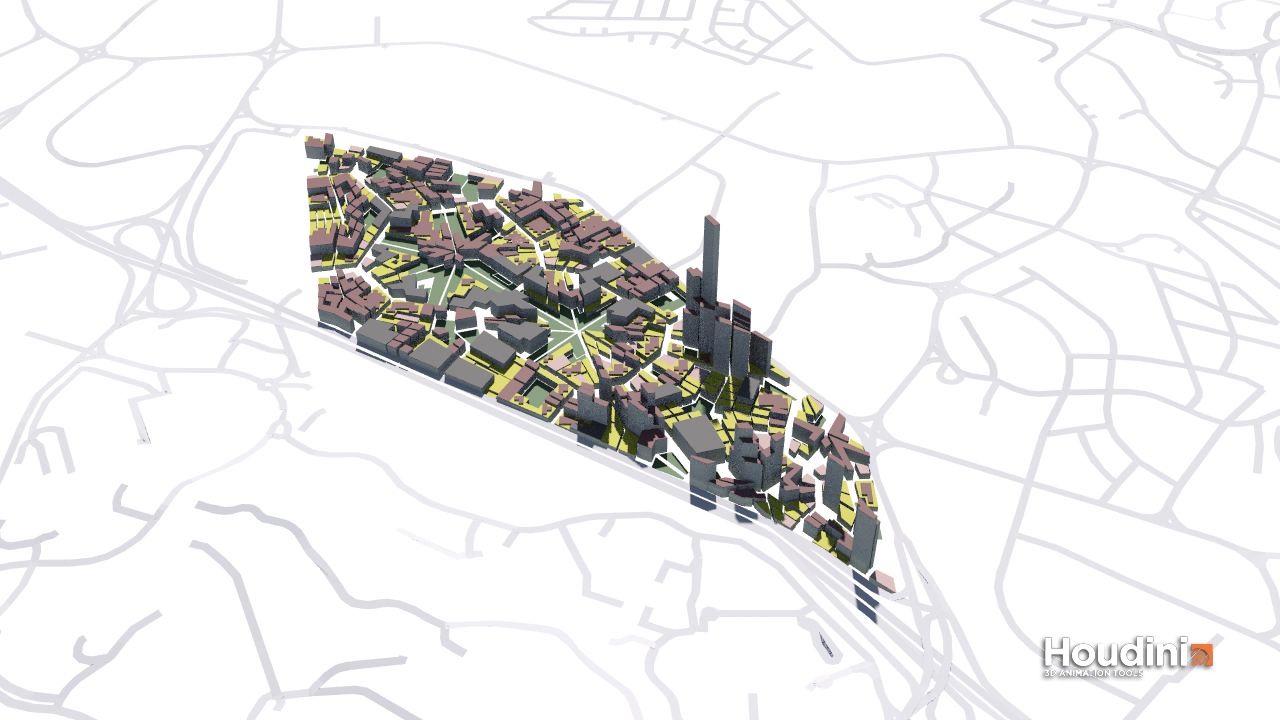
Result
The Relative Densities were compensated with its respective footprint area before finally computing number of floors required for 75 000 people.
Environment Evaluation
- Percentage Good Windows: 20.7277
- Percentage Good VF: 38.2298
- Percentage Good SF: 86.1899
- Percentage Good PR: 96.9172
- Percentage Good DF: 40.6992
- Percentage Good Building: 48.9831
In this iteration, larger building masses serve as landmarks in the sea of small scaled buildings. There is a good distribution of programs around and the varying street width and urban grain creates a overall messy but interesting urban scape. However, some street width - height ratio is too low, resulting in poor urban spaces and poor environment evaluated buildings.